
WLC software release 7.4 introduced AVC – Application Visibility & Control feature where you can get the wireless traffic visibility. To complement this feature Cisco introduced netflow on WLC where you can export flow information from WLC to a netflow collector.
This post will describe how you configure Netflow feature on a Cisco WLC. First of all you have to enable AVC feature by creating a AVC profile & assign it to required WLANs where you want to get the visibility. Below show how to create AVC profile under “Wireless > Application Visibility & Control > AVC Profiles” . This post will not describe AVC in detail (how to control applications, policy action etc)
Via “WLAN > QoS ” section you can map AVC profile to WLAN. See below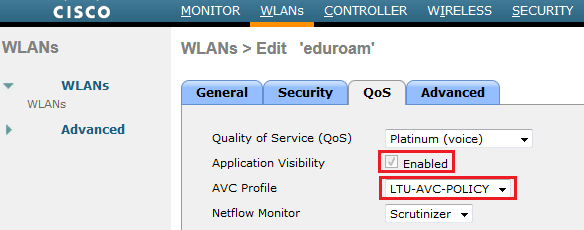
Then you have to create a Netflow exporter under “Wireless > Netflow > Exporter ” section. I have used Scrutinizer netflow collector tool as it is the only supporting flow expoerter for Cisco WLC flow format at the time of this post. You can use customize port number as well to export netflow data. WLC does not support multiple exporters & you have to select single exporter (if you have multiple) to work with WLC.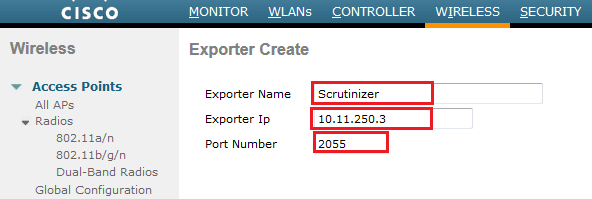
Next step is to create Netflow Monitor in ” Wireless > Netflow > Monitor ” section. Only single static flow record type can be exported from WLC (as oppose to flexible netflow in IOS devices). These records will be send in every 90s and that is fixed in WLC 7.4 which we cannot customized. I have named the monitor as “Scrutinizer” just for simplicity. You can use any other name if you want. Once you create this Netflow Monitor you can associate exporter name & flow record to it.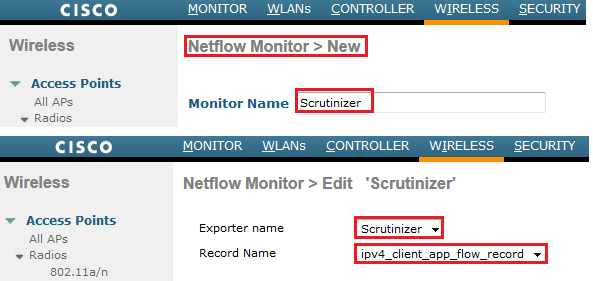
Finally you can associate this netflow monitor on to the WLAN you required to get visibility.
You can do the same via CLI as well. Here are the CLI commands to achieve this. Example shown below assume you have two WLANs (ID 1 & 2 ) where you want to get visibility through netflow.
config wlan disable 1
config wlan disable 2
config flow create monitor Scrutinizer
config flow create exporter Scrutinizer 10.11.250.3 port 2055
config flow add monitor Scrutinizer exporter Scrutinizer
config flow add monitor Scrutinizer record ipv4_client_app_flow_record
config wlan flow 1 monitor Scrutinizer enable
config wlan flow 2 monitor Scrutinizer enable
config wlan enable 1
config wlan enable 2
If you have installed the scrutinizer netflow application with required SNMP community (ensure that WLC is allowing Scrutinizer IP to communicate via SNMP) to talk to WLC, you would see your WLC is added into Scrutinizer. Once you click the required WLC & then Report List > Wireless Reports you can get pre-defined reports type for your wireless traffic.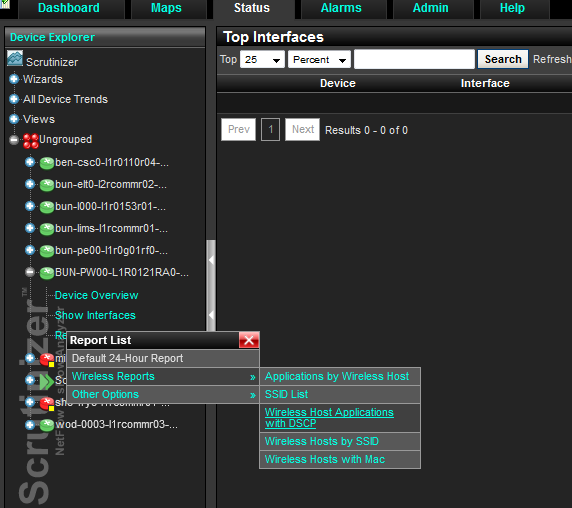
Below shows few sample reports to show the capability of this tool. I think you can easily customize these reports (if you have specific need) with the support of Scrutinizer guys.
This is the traffic statistics per SSID.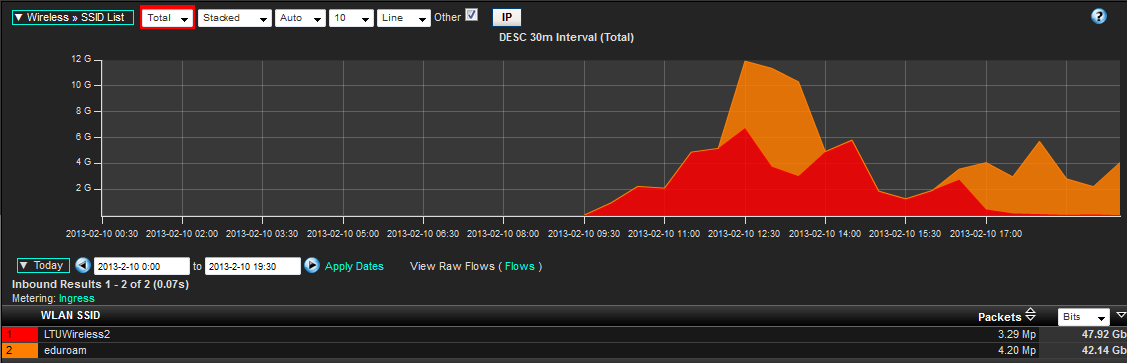
This report shows individual clients traffic with their MAC address & IP address.
There is a standard report available for applications by host where you can see each host different application types in wireless environment.
Enjoy of getting this visibility of your wireless traffic 😉
Related Posts
1. Day 0 with WLC 7.4 code
2. Who Really Support WLC Netflow ?
3. Overview of mDNS in WLC 7.4
4. Configuring mDNS in WLC 7.4
5.

Why is an AVC profile necessary to export NetFlow? Seems NetFlow can be configured on a WLAN with AVC profile=none.
Hi
Thanks for pointing this out.
As long as flow can be exported with AVC profile=none, then there is no need for a custom profile.
HTH
Rasika
Looks like AVC needs to be enabled, but an AVC Profile need not be provided for NetFlow to work. See http://www.cisco.com/en/US/products/ps10315/products_tech_note09186a0080bed910.shtml
HI Rasika Nayanajith Thanks for posting really useful information regarding the Avc & Netflow .My wlc 5508 showing in 802.11a global config that only low band is enabled mid & hidh bands are disabled.how can u enable all 3 bands.your suggestion is really helpful.
Would you be able to post “show sysinfo” output of your WLC ? I need to check configured country codes to see why those bands are disable. Also what AP models are you using ?
HTH
Rasika
http://jsahmin.wordpress.com/2014/04/24/sysinfo/ here is the output of sysinfo . Ap model iam using is cisco 3602i
Hi Nayarasi busy please find the post here .i have configured scrutinizer as netflow exporter in my wlc and installed scrutinizer on my laptop . but still im not able to receive any flows. i have mentioned the exporter ip 172.16.36.241 which is my laptop ip. provided the snmp community string. and enabled avc on wlan .still showing not receiving any flows. please suggest any where i have gone wrong .
Pls post “show 802.11a” output as well to confirm setting on that band.
http://jsahmin.wordpress.com/2014/04/24/band-disabled/ please find the 802.11a output
Thanks for those input. I would check the regulatory domain of APs used in this controller to make sure it is “-C” domain which is for Malaysia. See this doc for reference.
http://www.cisco.com/c/en/us/products/collateral/wireless/aironet-1300-series/product_data_sheet0900aecd80537b6a.html
This is not configurable parameter & as long as you are using correct regulatory domain products these band should be enabled.
As per this doc, there is no restrictions to use those mid & high bands in Malaysia
Click to access SRSP534WLAN.pdf
If this is a WLC you can play with, I would try to configure different country code & connect different regulatory domain AP to see it make these band enable (obviously this is only for a testing)
HTH
Rasika
Hi Nayarasi Thanks for your support regarding the bands .Although its a wlc.please can u post some screenshots or relevant link to change the regulatory domain if possible.will the users loose connectivity if the country code & regulatory domain being changed. please advice any suggestions.
One more thing Nayarasi avc profile configured not able to gather stats for unknown users. its only generating stats for users logged in with username . in our environment we have guest & corporate wlans .users who logged in to guest without username in wlc have no avc stats being generated . is there a alternative to track their usage as we canot create a username for each time a guest user comes to our guest-wlan. please provide if any suggesions.
Hi Nayarasi busy please find the post here .i have configured scrutinizer as netflow exporter in my wlc and installed scrutinizer on my laptop . but still im not able to receive any flows. i have mentioned the exporter ip 172.16.36.241 which is my laptop ip. provided the snmp community string. and enabled avc on wlan .still showing not receiving any flows. please suggest any where i have gone wrong .
Mate, from PI2.2 Netflow default port changed to 9991, better mention or update it 🙂
Thanks for the update.
Pingback: Wireshark Netflow | Home
Does PRTG correctly analizing NetFlow on WLC? In my case dashboard show only “Other” traffic without source and destination IP, ports, protocols. Only traffic volume…
Hi Michael,
Not sure about PRTG, I would assume it would not. As WLC netflow records are not similar to standard netflow record fields your collector should understand those WLC netflow fields to represent data correctly.
HTH
Rasika