
Have you ever get complaints from users stating “Network is too slow” ? how do you measure network throughput in your environment ? It is always good idea to benchmark your network(wired or wireless) performance. In this way when a user complaint about slowness, you can run a quick test again & compare it with your baseline performance results.
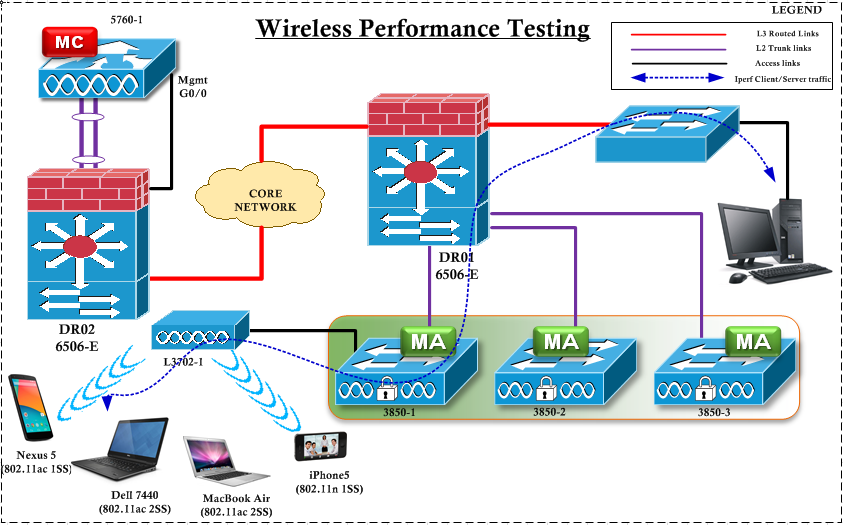
Iperf is great network performance testing tool (free 🙂 )you can use to measure throughput of a given network. In this post we will see how we can use it to measure wireless network performance. We will primarily focus on wireless performance testing & will use shown topology diagram where few different type of clients connect to my converged access setup.
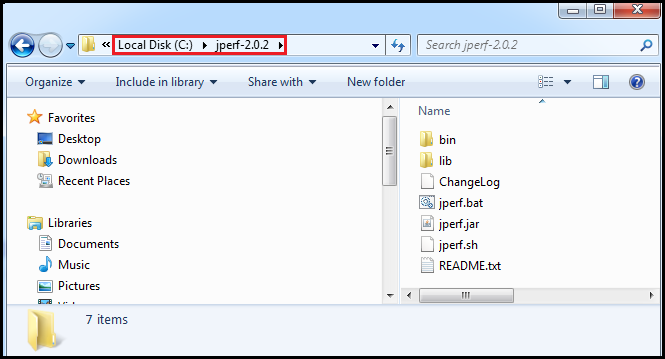
 I have used a wired connected window PC as my iPerf server. You can simply download jperf from here. Once you download jperf-2.0.2 you can copy that onto your computer C: drive as shown below.
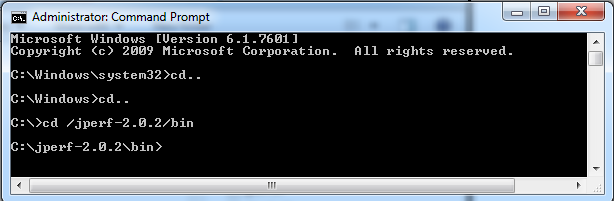
 Once you do this you can go to “C:\jperf-2.0.2\bin” in the command prompt as shown below. If you like to run this jperf app in graphical user interface (GUI) then you can run jperf.bat & you can follow this useful guide in that case.
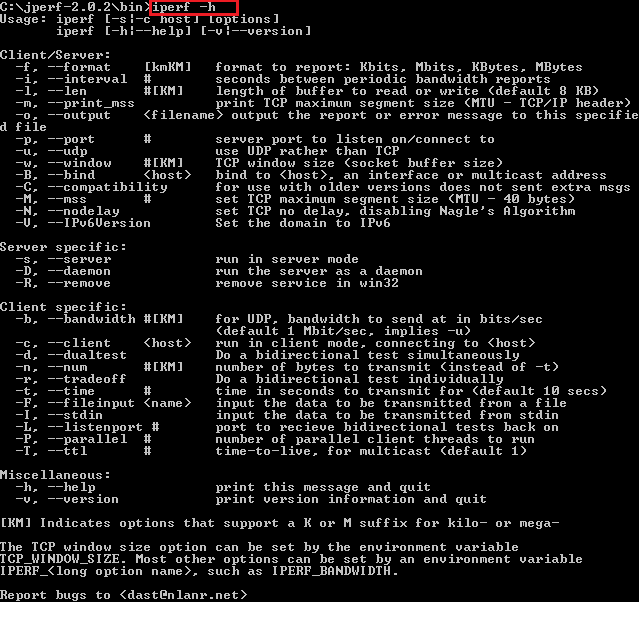
 If you want to use it as “Iperf Server” you have to use “iperf -s” syntax. If you want to set it as “Iperf client” then you have to use “iperf -c <server-ip-address>” There are optional parameters you can set. You can view all of these “iperf -h” as shown below.
 Prior to measure wireless performance you need to make sure your wired network won’t be a bottleneck. Sometime there may be QoS policies throttling standard UDP/TCP port numbers used in this application. So it is good idea to benchmark using wired connection first & them move to wireless performance.
In my case I have connected my laptop onto 3850-1 via 1G Ethernet & run it as Iperf client. I have used 1s interval , 1MB as TCP window size & run it for 2min (120s),sometime if you leave default TCP window size, your throughput will reduced. So test it & use a value that gives close to expected results.
When you read this test result shown in below, it tells you about bandwidth available from iperf client to iperf server (ie client upload & server download). As you can see I got ~900Mbps.
C:\jperf-2.0.2\bin>iperf -c x.x.13.31 -i 1 -t 120 -w 1M
------------------------------------------------------------
Client connecting to x.x.13.31, TCP port 5001
TCP window size: 1.00 MByte
------------------------------------------------------------
[168] local x.x.13.20 port 56898 connected with x.x.13.31 port 5001
[ ID] Interval       Transfer     Bandwidth
[168]  0.0- 1.0 sec   105 MBytes   885 Mbits/sec
[168]  1.0- 2.0 sec   105 MBytes   881 Mbits/sec
[168]  2.0- 3.0 sec   112 MBytes   939 Mbits/sec
[168]  3.0- 4.0 sec   107 MBytes   897 Mbits/sec
[168]  4.0- 5.0 sec   106 MBytes   888 Mbits/sec
[168]  5.0- 6.0 sec   109 MBytes   914 Mbits/sec
.
.
[168] 110.0-111.0 sec   108 MBytes   906 Mbits/sec
[168] 111.0-112.0 sec   111 MBytes   933 Mbits/sec
[168] 112.0-113.0 sec   109 MBytes   916 Mbits/sec
[168] 113.0-114.0 sec   111 MBytes   927 Mbits/sec
[168] 114.0-115.0 sec   108 MBytes   908 Mbits/sec
[168] 115.0-116.0 sec   111 MBytes   934 Mbits/sec
[168] 116.0-117.0 sec   111 MBytes   930 Mbits/sec
[168] 117.0-118.0 sec   111 MBytes   930 Mbits/sec
[168] 118.0-119.0 sec   111 MBytes   933 Mbits/sec
[168] 119.0-120.0 sec  76.4 MBytes   641 Mbits/sec
[168]  0.0-120.0 sec  12.6 GBytes   903 Mbits/sec
To measure the client download, you can run “iperf -s” on the PC you ran as client previously. I have used 1M as TCP window size. This time you have to run “iperf -c x.x.13.20” command on the other PC.
C:\jperf-2.0.2\bin>iperf -s -w 1M
------------------------------------------------------------
Server listening on TCP port 5001
TCP window size: 1.00 MByte
------------------------------------------------------------
[268] local x.x.13.20 port 5001 connected with x.x.13.31 port 58151
[ ID] Interval       Transfer     Bandwidth
[268]  0.0-120.0 sec  11.5 GBytes   823 Mbits/sec
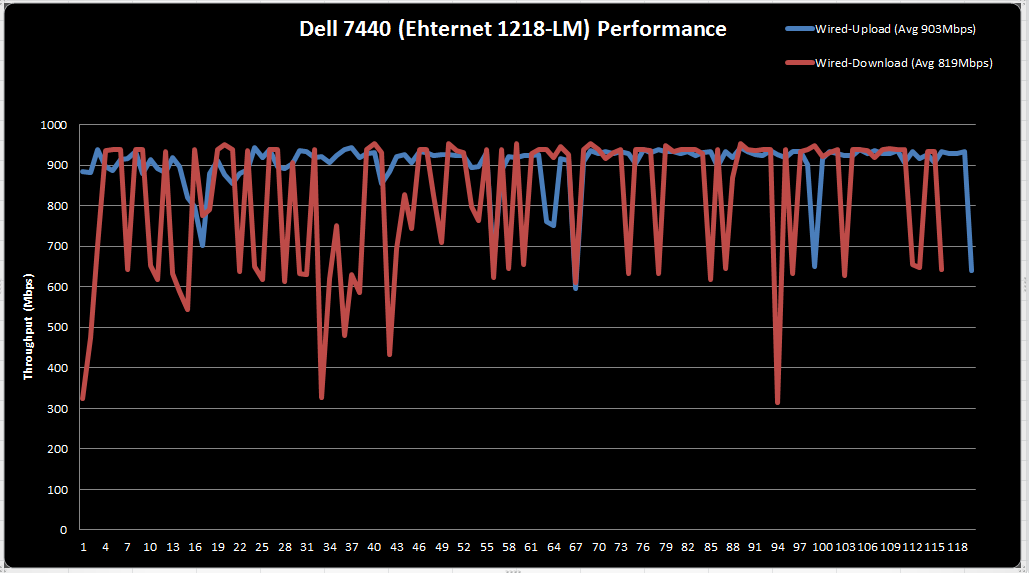
You can export these data onto excel & graph it for nice representation.(you can simply hold Alt button in windows & copy only the data rate values 🙂 ). So here is my graph look like for wired bandwidth performance.
 Let’s see now how can we measure the wireless performance. In my case I have created a SSID (Open Auth simpliciy) on my 3850 MA & 3700 AP register to it. So this is the simplest without any QoS policies on it.
wlan ABC 20 ABC
 no broadcast-ssid
 client vlan 1410
 no security wpa
 no security wpa akm dot1x
 no security wpa wpa2
 no security wpa wpa2 ciphers aes
 no shutdown
My AP is running on power level 5 & DCA channel width set to 80MHz. You can verify it shown as below
3850-2#show ap dot11 5ghz summary
AP Name            MAC Address     Slot  Admin State  Oper State  Channel             Width  TxPwr
---------------------------------------------------------------------------------------------------
3702-1             b838.6184.c670     1  Enabled      Up          (161,157,149,153)*     80    5(*)
Here I have connected a MacBookAir,Nexus 5 phone, Dell E6430, Dell E7440 to my AP for testing. You can get the details of client RSSI/SNR from the switch itself. I had trouble with AC-7260 driver getting this detail & this NIC/driver is giving some grievance to many of us(Here is some detail & I am using 17.0.5.8 driver version in this NIC)
3850-2#show wireless client summary
Number of Local Clients : 4
MAC Address    AP Name      WLAN State              Protocol
---------------------------------------------------------------
6067.2077.5470 3702-1        20   UP                 11n(5) <-Dell E6430
8086.f2cd.3c5f 3702-1        20   UP                 11ac <-Dell E7440
bcf5.acfe.eb1c 3702-1        20   UP                 11ac <-Nexus 5
8438.3540.2100 3702-1        20   UP                 11ac  <-MBA

**** MBA ****
3850-2#sho wireless client mac-address 8438.3540.2100 detail | in Signal|Rate
Current Rate : 12.0
Supported Rates : 12.0,24.0,36.0,48.0,54.0,12.0,24.0,36.0,48.0,54.0
  Radio Signal Strength Indicator : -40 dBm
  Signal to Noise Ratio : 52 dB

**** NEXUS 5 ****
3850-2#sho wireless client mac-address bcf5.acfe.eb1c detail | in Signal|Rate
Current Rate : m7
Supported Rates : 12.0,24.0,36.0,48.0,54.0,12.0,24.0,36.0,48.0,54.0
  Radio Signal Strength Indicator : -29 dBm
  Signal to Noise Ratio : 58 dB

*** DELL E6430 (N6205) ****
3850-2#sho wireless client mac-address 6067.2077.5470 detail | in Signal|Rate
Current Rate : m15
Supported Rates : 12.0,24.0,36.0,48.0,54.0,12.0,24.0,36.0,48.0,54.0
  Radio Signal Strength Indicator : -29 dBm
  Signal to Noise Ratio : 63 dB

*** DELL 7440(AC-7260) different to all others ****
3850-2#sho wireless client mac-address 8086.f2cd.3c5f detail | in Signal|Rate
Supported Rates : 12.0,24.0,36.0,48.0,54.0,12.0,24.0,36.0,48.0,54.0
  Radio Signal Strength Indicator : Unavailable
  Signal to Noise Ratio : Unavailable
Now on your wireless client (first in MacBookAir) if you run “iperf -c x.x.13.20 -i1 -t 120 -w 1M” you can measure the wireless client upload performance. As you can see below I got average 294 Mbps for wireless upload speed for this client.
Something:~ $ iperf -c x.x.13.20 -i1 -w 1M -t 120
------------------------------------------------------------
Client connecting to x.x.13.20, TCP port 5001
TCP window size: 1.00 MByte (WARNING: requested 1.00 MByte)
------------------------------------------------------------
[  4] local 10.141.96.19 port 54005 connected with x.x.13.20 port 5001
[ ID] Interval       Transfer     Bandwidth
[  4]  0.0- 1.0 sec  28.8 MBytes   241 Mbits/sec
[  4]  1.0- 2.0 sec  44.8 MBytes   375 Mbits/sec
[  4]  2.0- 3.0 sec  40.9 MBytes   343 Mbits/sec
[  4]  3.0- 4.0 sec  38.2 MBytes   321 Mbits/sec
[  4]  4.0- 5.0 sec  39.9 MBytes   334 Mbits/sec
[  4]  5.0- 6.0 sec  43.2 MBytes   363 Mbits/sec
.
.
[  4] 117.0-118.0 sec  42.9 MBytes   360 Mbits/sec
[  4] 118.0-119.0 sec  49.5 MBytes   415 Mbits/sec
[  4] 119.0-120.0 sec  42.6 MBytes   358 Mbits/sec
[  4]  0.0-120.0 sec  4.10 GBytes   294 Mbits/sec
If you run “iperf -s -w 1M” on my MBA & run “iperf -c 10.141.96.19 -i 1 -t 120 -w 1M” command on wired PC I can measure the wireless client download performance. Here is the wireless download performance (avg 304 Mbps) for MBA
C:\jperf-2.0.2\bin>iperf -c 10.141.96.19 -i 1 -t 120 -w 1M
------------------------------------------------------------
Client connecting to 10.141.96.19, TCP port 5001
TCP window size: 1.00 MByte
------------------------------------------------------------
[168] local x.x.13.20 port 55232 connected with 10.141.96.19 port 5001
[ ID] Interval       Transfer     Bandwidth
[168]  0.0- 1.0 sec  53.3 MBytes   447 Mbits/sec
[168]  1.0- 2.0 sec  48.2 MBytes   404 Mbits/sec
[168]  2.0- 3.0 sec  48.3 MBytes   405 Mbits/sec
[168]  3.0- 4.0 sec  49.5 MBytes   415 Mbits/sec
[168]  4.0- 5.0 sec  51.6 MBytes   433 Mbits/sec
[168]  5.0- 6.0 sec  52.6 MBytes   442 Mbits/sec
[168]  6.0- 7.0 sec  53.5 MBytes   449 Mbits/sec
.
.
[168] 116.0-117.0 sec  43.3 MBytes   364 Mbits/sec
[168] 117.0-118.0 sec  40.9 MBytes   343 Mbits/sec
[168] 118.0-119.0 sec  43.8 MBytes   367 Mbits/sec
[168] 119.0-120.0 sec  11.2 MBytes  93.9 Mbits/sec
[168]  0.0-120.2 sec  4.26 GBytes   304 Mbits/sec
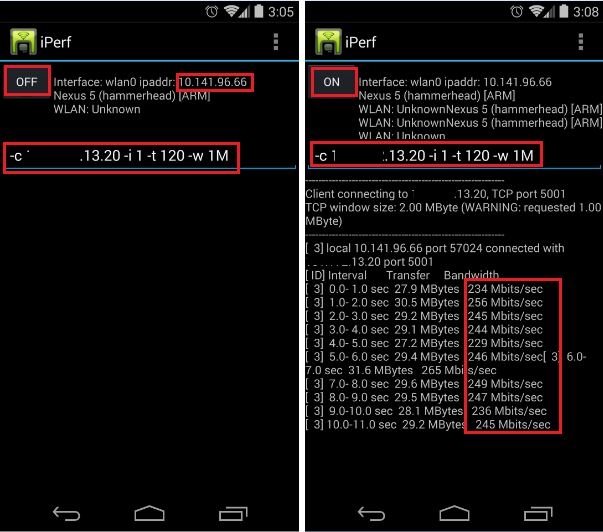
For any Android device you can install iperf application from Play Store for free 🙂 & then you can run these iperf client server commands. Here is a snapshot of Nexus 5 phone running as iperf client. For iOS device you have to pay ;(
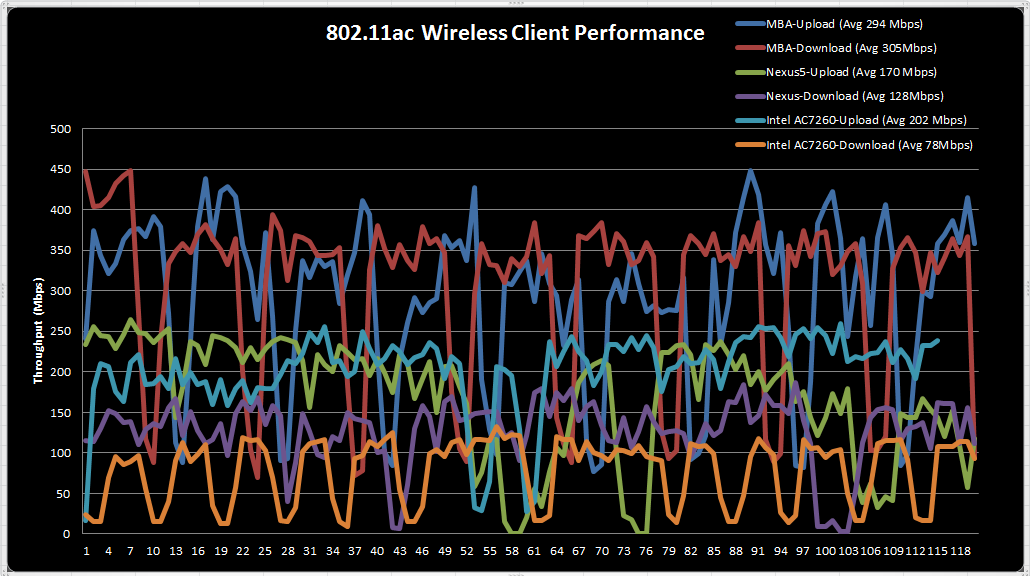
 Like this I have run this performance testing for all those clients mentioned & export that data onto excel. So here is the result I got for 3 clients who supports 802.11ac. As expected, MBA gave me the best performance out of these 3 devices.As you can see below I got less than 100Mbps (less than 1/3 of equivalent MBA) download speed for Intel AC7260 (though it is two spacial stream client). Even Nexus 5 (single SS clinet) performed much better in downloads. You may surprised 😯 by this result, but such is the way of life with this Intel 7260 driver.
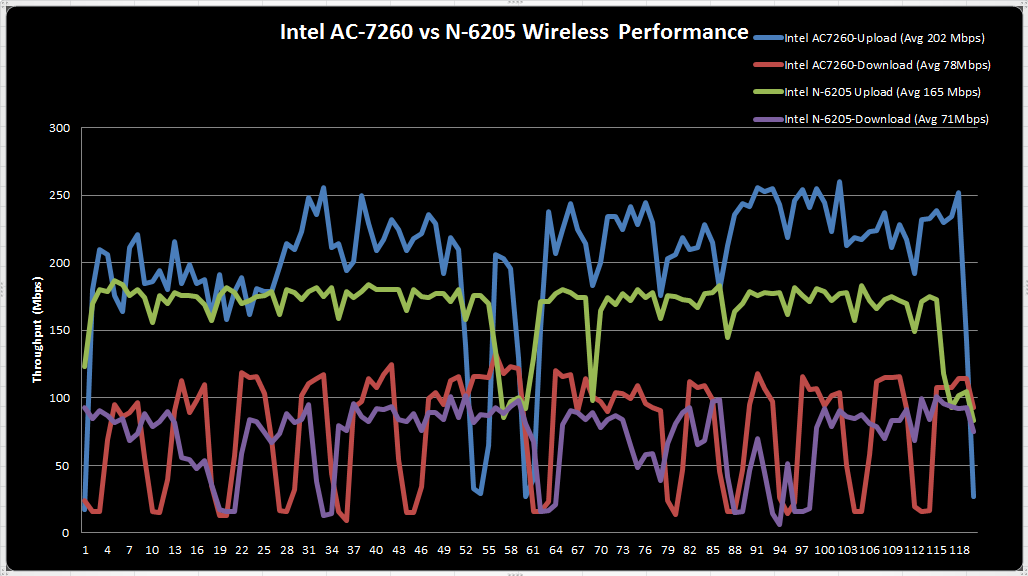
 Just to compare, I have done the test with Intel N6205 (802.11n) & compare the result with Intel N7260(802.11ac 2 SS). As you can see below you will get marginal differences between those two.
 Hope this is useful to you as well. When next time you get a slowness complaint, always measure network performance like this.
PS: There are lots of commercial apps available if you willing to pay for these type of testing. I have given you a simpler method & cost you nothing, but you have to do some manual work.

Nice effort Rasika!
Thanks Florin.
Greeat post!
Thanks Tim
Hi Rasika – Excellent post. How we can use Wireshark in Wireless environment to measure the Throughput?
Thanks Kumar,
Wireshark is great tool to analyze wireless captures, it does not directly help to measure throughput
HTH
Rasika
Another great post, thanks Rasika. This was on my ‘to do list’, I guess my task will be easier now.
Thank you…:)
Interesting to see a person download jPerf and not use the ‘j’ part, including the GUI 🙂 Any specific reason?
No specific reason 😉 I used to iperf via CLI & that’s the reason leaning towards CLI.
Also if you want to compare multiple devices results in one graph, CLI output would do it easily
HTH
Rasika
Nice post Rasika, thank you. I’ve noticed that you’ve mostly used TCP, how about UDP?
Hello Rasika,
i am always eager to turn into your post when it comes to advanced tshoot.
i wanted to ask you about the following: for a wireless client connected to a 2.4ghz, at 144.4 Mbps data rate, is the theoretical maximum throughput at around 70Mbits? (considering that drivers are up to date and there is enough back-haul throughput to accommodate this test). thanks
If you get around 50% of the data rate as throughput then I would say it is practical value most of the time we get.
If you have less overhead in your wireless media, this may go up 60-70%, depend on each RF environment.
But in average, I would say 50% is a good value.
HTH
Rasika
Hello Rasika,
is there any formula to calculate theoretical maximum achievable throughput
GREAT POST. Period.
Hi Nayarasi, I wrote an email tto you seeking for your further advice. Would you be available to reply? It’s very much appreciated. Thanks in advanced.
Yes, I saw your mail, will reply over the weekend
Rasika
Rasika, hope to see your reply soon 🙂 & thanks for educating
Replied to your mail, Hope it is useful.
How would this actually compare to a Fast Ethernet 10/100 link? Some laptops I have are 10/100 FE and I can replace Wireless PCIe with AC with needed.
All depend on where you connect your AP ? if it is connect to 10/100 switch then that is the bottleneck.
But if you see only 10/100 wired NICs on end devices, then having a better wireless adapter may help (but if end device is too old, not sure what sort of throughput it provide even with newer wireless adapter)
HTH
Rasika
Hi,what is the main cause for having greater throughput in udp than tcp?
Coz there is no ACK Policy in UDP unlike TCP as TCP is connection oriented.