
Tags
ECA, EDA, ETA, EXA, ExtraHop, ExtraHop Addy, WLC netflow
Recently I got an opportunity to work with a product called “ExtraHop“. If you are already familiar with that product then you may not want read this post to realize its value. If you haven’t come across this product yet, then please read further and get an idea how can it help you in your network environment.
We got this tool as a replacement of our Netflow monitoring tool. But it has much more capability than simple netflow monitoring. Primarily it is a big data analytics platform that can help you with following. It is a very powerful tool for
- Network/Application Performance monitoring
- Network Security ( Threat Analysis, Forensic investigation/Machine learning)
- IT Operations (Real time analytics, Network Baseline)
ExtraHop solution can include different components (it can be physical appliances or virtual servers)
- EDA – ExtraHop Discover Appliance (Top level application monitoring-metadata)
- EXA – ExtraHop eXplore Appliance (for transaction level details)
- ETA – ExtraHop Trace Appliance (for packet captures)
- ECA – ExtraHop Command Appliance (management appliance)
Below diagram shows how these components interact with each other You do not require all of those components to start with. EDA is the primary component that you should have to begin with. It can be deploy as a standalone unit or you can integrate it with a command appliance (ECA), usually a VM. With ECA, you can have multiple EDAs, but still you can manage all via ECA. Here are different platform options available.
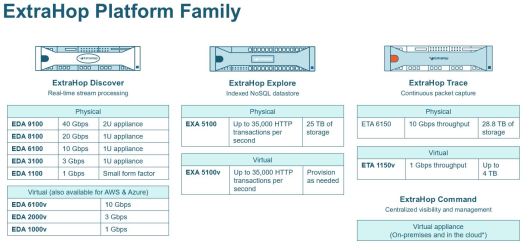
Mainly EDA get data feed from two different sources
- Wire data ( from SPAN/RSPAN/ERSPAN)
- Flow data ( Netflow data from network devices/servers/etc)
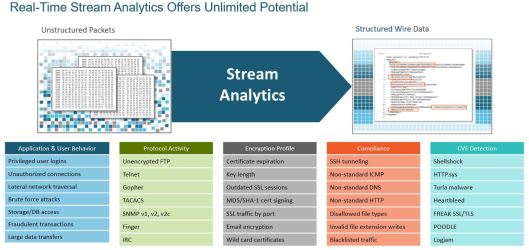
Below diagram summarize the capability of this wire data with ExtraHop. It does not store all the raw-data, so you will keep required meta-data and provide deep analytics on wire speed.
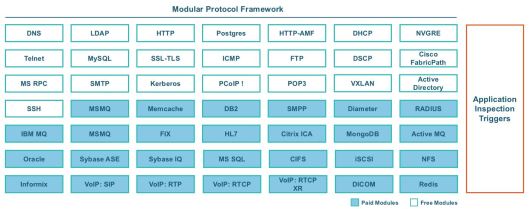
Here is the protocol breakdown that it can analyze. Those are highlighted are paid modules if you want to get visibility of those protocols.
Once you go to Metric > Sources > Applications > All Activity, you can get a summarized view of all your wiredata that you sending to EDA. That a great way to get an overview of each of those applications.

Having this sort of visibility of your network will give you enormous value. You do not want to install any agents on application servers, any polling mechanisms or traps from those systems (like SNMP, Syslogs) to get that visibility. Here is a summary view for NAS performance that you can choose from “Activity” section breakdown.

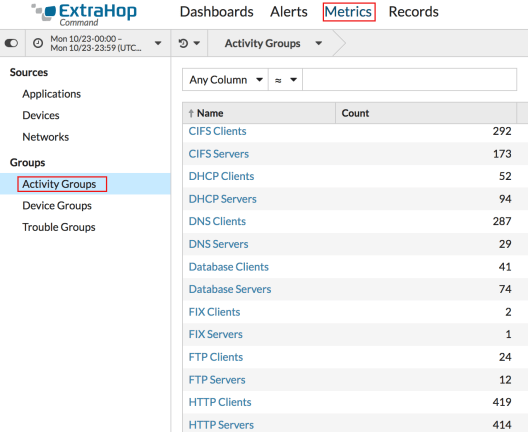
System will automatically group based on activity (Metrics > Groups > Activity Groups) , so you can easily find out those applications you want to have a performance monitored. You can easily navigate to a system that you want to know about from there as well.
If you have specific server performance to monitor, then you can filter that by navigating to Metric > Sources > Devices & then search for specific server. I used one of CMX server to monitor its activity.
As you can see from overview page, you can easily find application throughput, what are the top protocol used by this applications. It is a great way to know your environment how these applications work. Also it will classify “server” & “client” activity of those protocol monitored by ExtraHop

If you click activity map, you will get a snapshot of what other systems is communicating with given CMX. In my example CMX is communicating with WLCs suing SNMP, SSL where as it use TCP & SSL to communicate with Splunk server. Size of those circles indicate traffic volumes (so you can easily identify what to focus based on traffic volumes)

You can create your own dashboards & share it with user who manage those applications. To get an overall view of your environment, you can go to system level dashboards. It has two views, “Network” & “Activity” dashboards.
Here is what you see in Network dashboard

From the Activity dashboard, you can get an idea of top applications and summary of each application protocol. This is really useful to know your baseline and help you to quickly identify any anomalies of your traffic patterns.


This product has some other advantages too. Since you can access these metadata easily, you can develop your own bundles to monitor custom applications. Here is a link to already available bundles.

If you go to Metrics > Networks section, you can see all devices that sending netflow data on to it. Then you can select required interface traffic to be monitored.
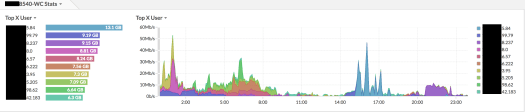
Below shows traffic distribution of WLCs.

With respect to wireless netflow, currently, ExtraHop is not supporting all the fields of Netflow traffic send by Cisco WLCs (As detailed in this post). I would like to work with them and get it improved. If they do, below details can be username instead of IP address (in wireless given user device can assign different IPs, so stats per IP does not make much sense)
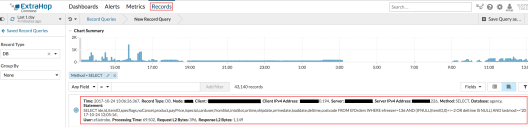
If you have EXA appliance (VM or Physical) you can get transaction level details. “Records” option highlighted gives that detail. Below example shows it can see specific SELECT query run on a database server by a client
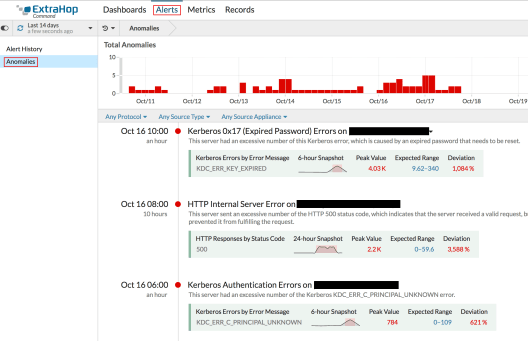
It also got some advanced capability such as anomaly detection based on machine learning (This feature is called Addy, Refer this packet pusher podcast for more details how it works). Basically it will detect anomolies and alert you, in the background it will take some intelligent decisions & respond differently if same alert keep continuing (eg it may disregard as network admins not treating it genuine).
You can use “Alert” view on GUI to see those anomalies. Here is an example
As you can see, it is a very powerful tool that will help you to get real visibility of your network and assist you keep it secure. You can register for a demo by using this link.
Update: 03-Nov-2017
My post got Extrahop’s attention and they have published a post on their blog about our experience. Please read it from here:

Hi,
Can you provide guesstimate? How much would be the starter kit for environment with 100 Network devices?
Tx,
Sent from my iPhone
>
Hi Ranga,
You can be touch with Khurram (khurram@extrahop.com) our SE to get detail about pricing.
HTH
Rasika
Hi
Thanks for the summary.
I fails to understand what is the big difference between extrahop riverbed or netscout
Hi Omar, ExtraHop uses a stream processing approach to extract L2-L7 metadata about network conversations in real time, without storing the raw packets. You can add an optional appliance to do continuous pcap, but it’s not required as with Riverbed or Netscout. This analysis-first approach gives ExtraHop much greater scalability, “real-timeness,” and lookback. The traditional method of storing all packets and then querying them does not lend itself to proactive operations because you tend to have to ask the system questions to get Layer 7 answers. With ExtraHop, the system will tell you.
Hi Tyson,
Thank you very much for your response , much appreciated
Rasika
Tyson, your comment about NETSCOUT is not actually accurate. NETSCOUT like Extrahop uses metadata to understand network conversations. You can choose to store packets (with or without payload for security reasons) and monitor up to 40G or 100G networks.
Great post! Do you know if ExtraHop addressed this lack into Wireless Performance visibility?
Hello
Thanks for posting this amazing blog. It consists of very useful information. The language you used in this is very simple & easy to understood. Post some more blogs related to “proactive network monitoring “.
Thanks & Regards.
Thank you very much for kind words. I will consider your feedback when writing future post.
Regards
Rasika
Hi Nayarasi, we have the EDA/EXA/ECA solution but now we want to integrate EAST/WEST traffic through ERSPAN between VDswitch and EDA but for some reason, the EDA ERSPAN interface is not reachable I mean to Ping, is that normal behavior? do you have any guidance to set up this? we are just connecting the EDA ERSPAN interface to access port 10GB to create the tunnel to VdSwitch…
any help will be appreciated
Thanks
Hi Edurador, what EDA appliance you got (virtual or physical). I do not think reachability will be impacted when you configure it. Make sure you follow. Here is a guide for nexus switches
https://docs.extrahop.com/8.6/configure-erspan-nexus-1000-v/
I suggest work with ExtraHop support team if you face challenges on bringing it up
Rasika