
How do you proactively (prior to user complaints) identify wireless related issues in your environment ? Almost every one of us uses a WNMS (Wireless Network Management System) to monitor wireless environment (WLC/AP) & notify if there is something abnormal. These NMS use protocols like SNMP, Syslog, Netflow collect information from WLC/AP etc.
In this post we will see how we can use splunk to analyze syslog messages generating by WLC/AP & give us meaningful reports to identify an underlying problem quicker.
You can get free Splunk Enterprise 60-day trial ( limited to 500MB per day) from here. I have installed (windows version) spunk in my home lab to monitor the syslog coming from below devices.
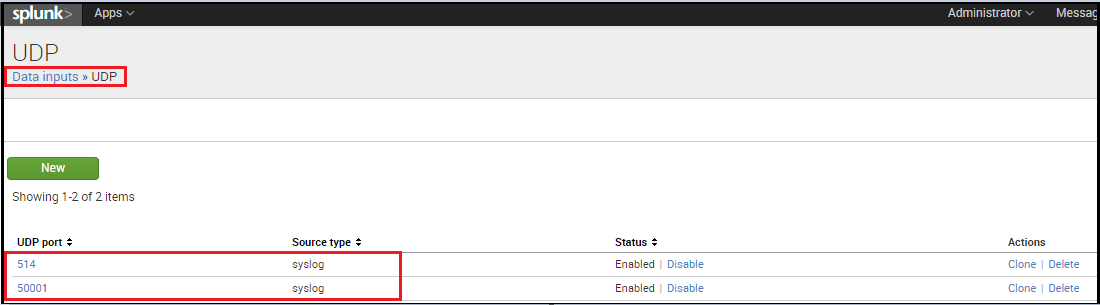
 Once you installed it you can set up syslog as one of Data Inputs. I have set it up with standard UDP 514 & custom UDP 50001 (for the devices I can customize syslog port).
 Once you set up your Splunk server to receive syslog messages you have to configure your WLC/AP devices to send syslog messages to your Splunk Server. Here you configure in on 3850 (any Cisco IOS/IOS-XE running device). You can use custom UDP port for syslog in those devices.
logging buffered 100000 informational
logging facility local3
logging source-interface Vlan20
logging host 192.168.200.2 transport udp port 50001
If you really want to see syslog coming from your APs as well you can set it. Here is how you can set it for APs managed by this 3850. Note that for AP syslog you cannot customised the UDP port number & default to UDP 514.
3850-1(config)#ap syslog level information
3850-1(config)#ap syslog facility local7
3850-1(config)#ap syslog host 192.168.200.2
Here is how you can configure Syslog in AireOS WLC. In my case I have configured it on my 4402.
(4402-3) >config logging syslog host 192.168.200.2
System logs will be sent to 192.168.200.2 from now on
(4402-3) >config logging syslog facility local3
(4402-3) >config logging syslog level informational
Here is how you configure syslog for APs managed by AireOS WLC.
(4402-3) >config ap logging syslog facility local7 all
(4402-3) >config ap logging syslog level informational all
(4402-3) >config ap syslog host global 192.168.200.2
Setting the AP Global Syslog host will overwrite all AP Specific Syslog host configurations!
Are you sure you would like to set the AP Global Syslog host? (y/n) y
AP Global Syslog host has been set.
Now if you go & check your Splunk server you should be able to see all those syslog messages comes to your server. You can extract certain field of these messages where you can use later on for your analysis. I have created a field called “syslog-msg” to extract the mnemonics of syslog message (eg %SOAP_FIPS-2-SELF_TEST_RAD_SUCCESS: ) . You can go to “Settings -> Fields -> Field Extractions -> Add a new one”
(?i)^[^%]*%(?P<syslog_msg>[^:]+)
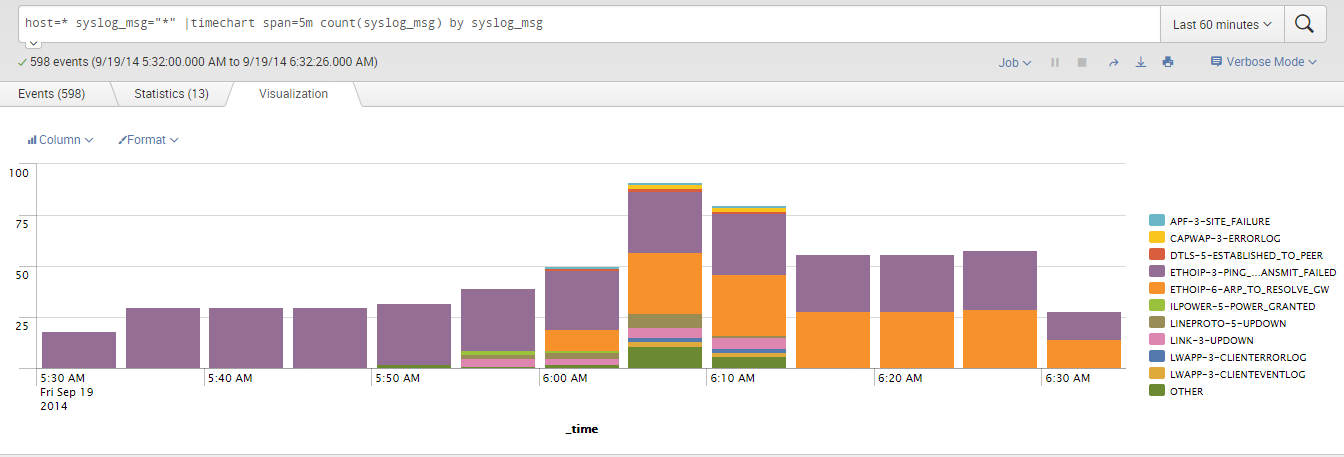
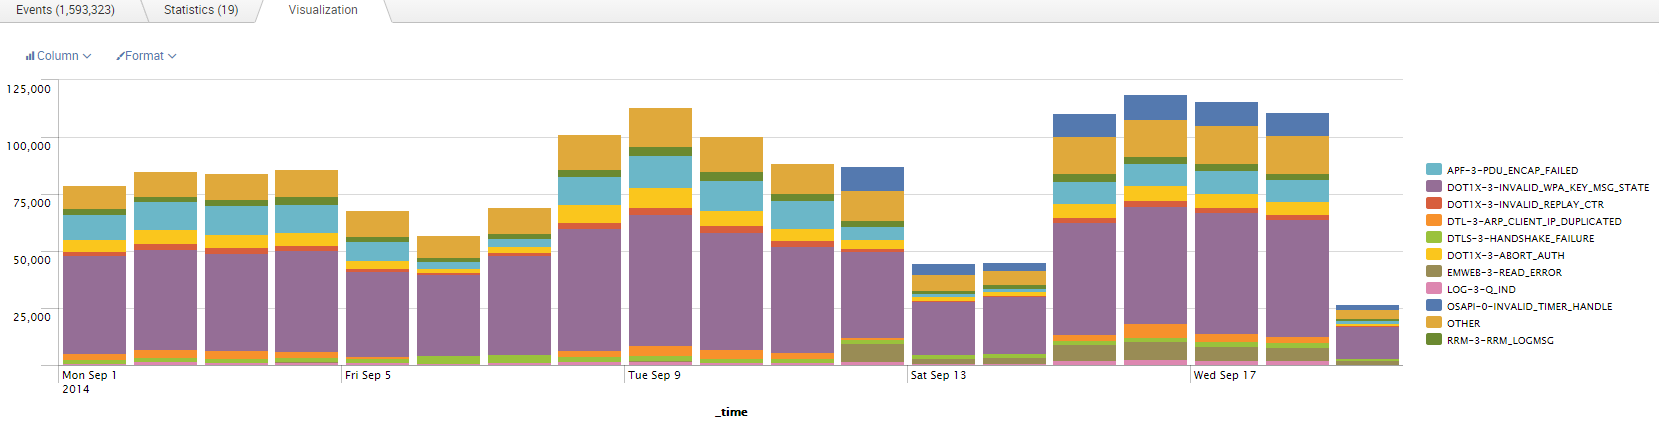
Now you can analyze these syslog messages by syslog message mnemonics. I have simply used host=* for all type of devices. But if you have properly named your devices, you can filter this based on WLC (eg host=*WC* if name contain WC) or based on AP.
host=* syslog_msg="*" |timechart span=5m count(syslog_msg) by syslog_msg
Here is the visualization of that stat.
 Sometime all these syslog messages does not have same weight, so some messages are important than others. So it is important you to able to analyse these based on thier severity level. So you can create an another field extraction field for that. So I have created a field called “msg_severity” to extract Syslog Severity information.
(?i)[#%].*?\-(?P<msg_severity>\d+)\-\w+
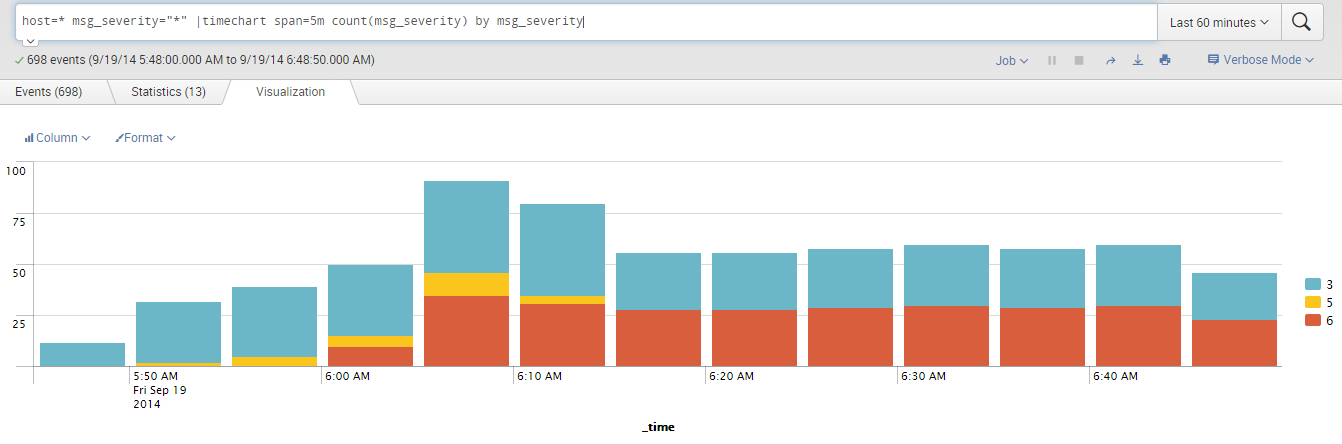
You can use below search string if you want to see the syslog messages based on its severity.
host=* msg_severity="*" |timechart span=5m count(msg_severity) by msg_severity
Here is the visual representation for each 5 min interval in last 60min. Now you can see easily any critical syslog messages at a glance.
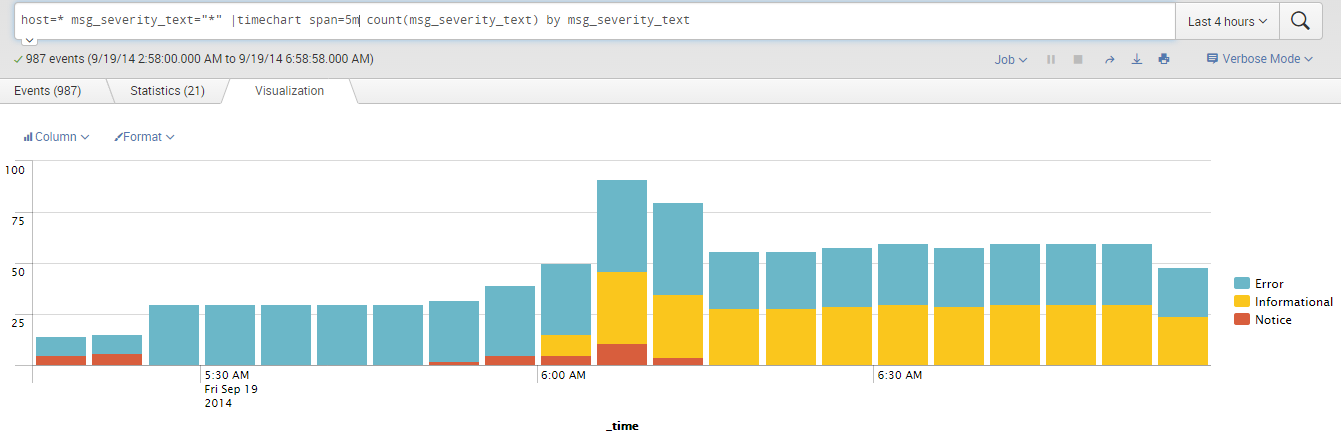
 If you want to map these severity levels to names (like 7-debug, 6-information, 0-Emergency) you can do that as well. I have created a “msg_severity_text” under “Settings -> Fields -> Calculated Fields->New” with below expression.
case(msg_severity == 0, "Emergency", msg_severity == 1, "Alert", msg_severity == 2, "Critical", msg_severity == 3, "Error", msg_severity == 4, "Warning", msg_severity == 5, "Notice", msg_severity == 6, "Informational", msg_severity == 7, "Debug")
now graph looks like this if you use “msg_severity_text” instead of “msg_severity“.
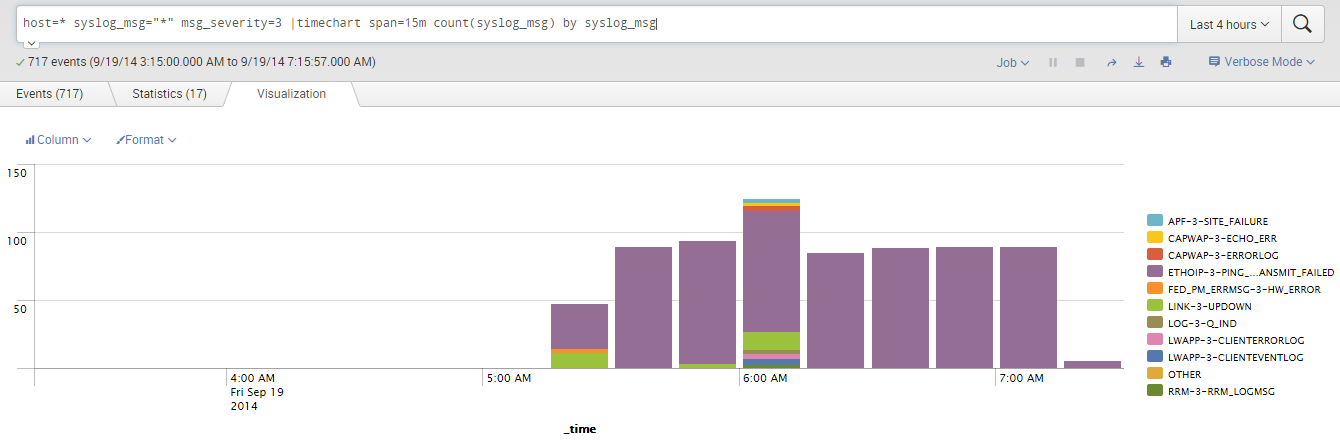
 Now if you see some higher severity “Emergency-0, Alert-1, Crtical-2” messages you can quickly identify what those are & can work on proactively with respective vendors. Here is how you can get particular severity (I have chosen error-3 as I do not see higher severity msg in my lab setup) using following search criteria.
host=* syslog_msg="*" msg_severity=3 |timechart span=15m count(syslog_msg) by syslog_msg
Here is the graphical view
 Here is some examples of practical scenarios I used this method to quickly identify some issues of my wireless network.
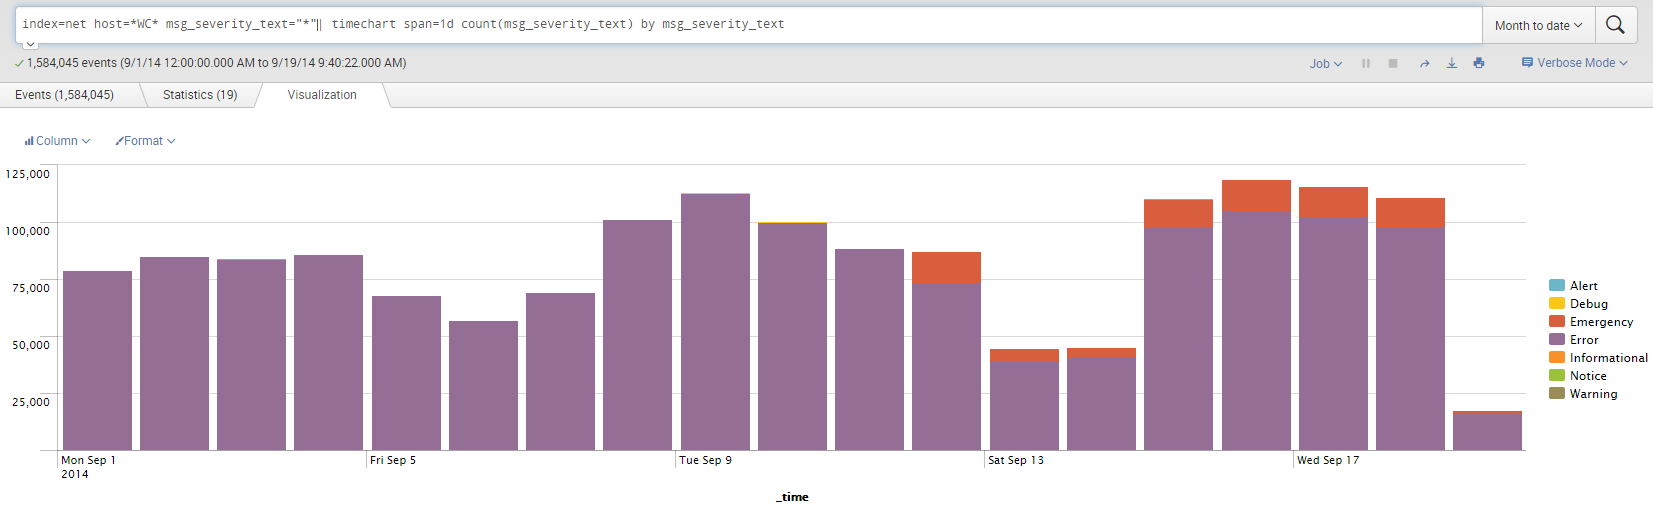
Example1: We upgraded our Anchor WLC to 8.0.100.0 on Friday 12th, as you can see below our baseline has been changed & influx of Emergency level messages are appearing since then.
 Once you drill-down that syslog message category, you can see the particular WLC & what type of messages are they. (WIP with TAC & looks like it is CSCup66509 🙂 )
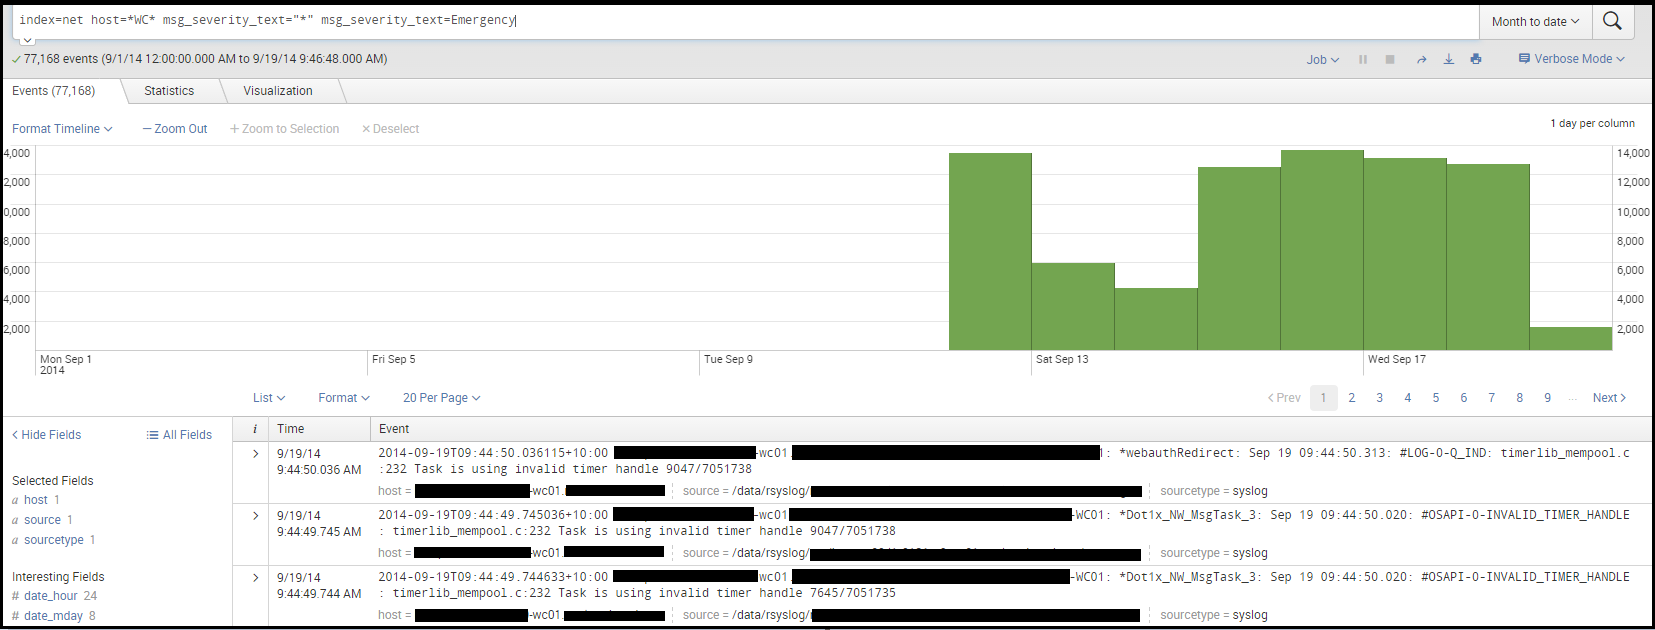
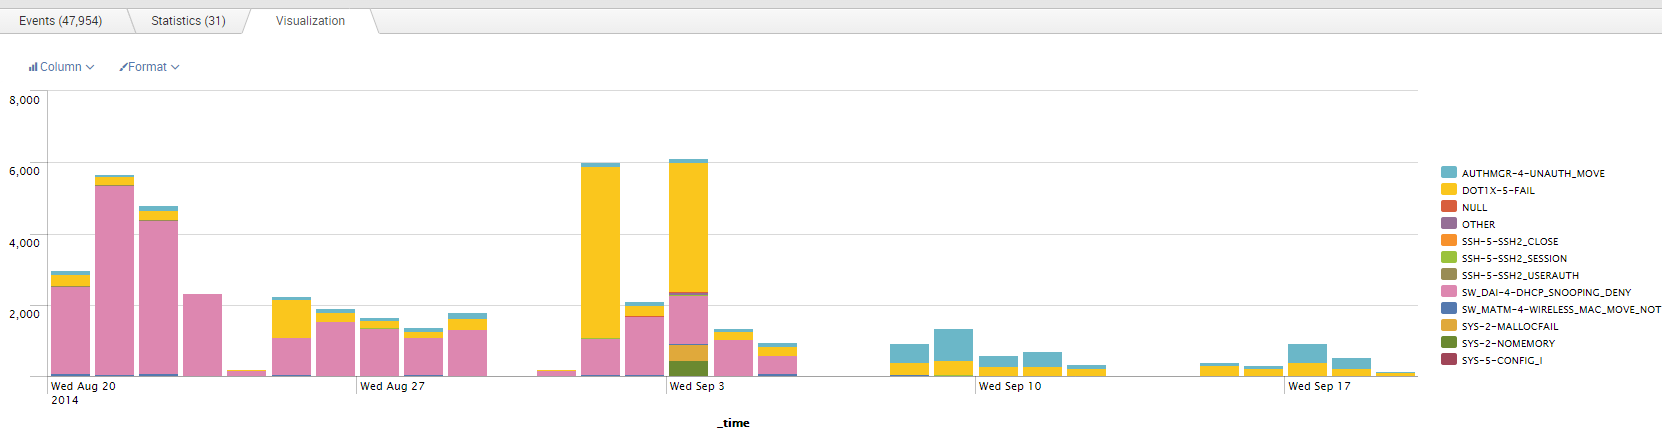
Example2: During a Converged Access deployment, we have enabled (on 20th Aug)”ARP-Inspection” for wireless user vlans for a given 3850 switch (as per Cisco’s recommended best practice). Since that time switch gave lots of ” DHCP_SNOOPING_DENY” & within 2 weeks it resulting memory exhaustion & excessive 802.1X failures. So we have removed this feature on 5th. As you can see below this is much clearer representation of what’s going on your network.
 Now here is a gotcha to remember if you are using Cisco WLC with latest software (7.4.x onwards). Due to some buggy behavior (CSCul11353) Cisco has changed starting string to # instead of %.
 So your field extraction for “syslog_msg” field should consider both # & % as shown below.
(?i) .*?: [#%](?P<syslog_msg>\w+\-\d+\-\w+)(?=:)
Once you do that you can extract those messages from latest code running WLC. Here is an example.
 Then recently I noticed in WLC 8.0 CLI below options & got excited that cisco enable sending syslogs comply with RFC-5424 in WLC 8.0 code. When trying to configure it failed. So reached out the TAC on this (CSCuq84698) & found out (unfortunately 😦 ) it is a config setting Cisco forgot to remove from this code. If you like to have this feature then you can make a new feature request through your Cisco AM/SE. I think you should do that as well if you see a value of it.(once it is accordance with standard you may not want to do these sort of tweaks to get what you want, there may be a standard syslog dashboard from Splunk itself)
(WLC) >config logging ?
buffered       Set buffered logging parameters.
cache          Set logging cache parameter
console        Set console logging parameters.
debug          Set debug message logging parameters.
exception      Limit size of exception flush output.
fileinfo       Set source file information logging parameters.
rfc-5424       Configure logging massage of RFC 5424.
stats-interval Configure stats interval.
syslog         Configure parameters for outgoing syslog mesages.
traceinfo      Set traceback information logging parameters.
upload-interval Configure upload interval for sending messages to remote server.
upload-threshold Configure real-time messages threshold.

(WLC) >config logging rfc-5424 enable
Failed to enable RFC8424.
Again kudos to my colleague Gareth for helping me on these reg expression used in this post.
Related Posts
1. Syslog & Msg Log in WLC
2. Syslog Msg Suppression

I suggest you test out my Cisco IOS app for Splunk. It contains lots of extractions, but is mostly centered around Cisco’s Routing and Switching products. I’m working on WLC support too and would be happy for any feedback. The apps are available here: https://apps.splunk.com/app/1352 and https://apps.splunk.com/app/1467
Hi,
thanks for the link. I will try to use it & give you feedback
HTH
Rasika
I’ve used the Cisco IOS app and found my way here. Would like to see progress in you two talking more.
Thanks alot
CM
Hi Rasika,
Can we see user creation or configuration changes syslog messages in wlc 8.0.100.0 ?
Regards
Nomair
I do not thinks it is possible Nomair.
Rasika
Hi,
I have pair of 8510 WLCs in HA deployment running 8.2.166.0 software version. Couple of weeks ago I have noticed that one of the redundant peers failed and nothing was sent to the Splunk syslog server. The question is: what
Here is the question:
what is the syslog level that is generated when HA failover takes place on WLCs?
I will test & let you know what I see as syslog
Rasika
Do you have a similar blog of logging 9800 wlc’s to splunk?