
WiFi Spectrum Analyzer considerations
– Frequency
– Form factor
– Price
– Hardware Platform
– Resolution
– Supporting Software
– WiFi integration
Free Space Path Loss(FSPL)
FSPL isthe loss of signal energy caused by the natural broadening of the waves, often referred to as beam divergence.
If distance(d) in miles between antenna, ferequency (f) in MHz then FSPL in dB.
FSPL=36.6 + 20log (f) + 20log(d)
If distance(d) in kilometers between antenna, frequency (f) in MHz then FSPL in dB
FSPL=32.4 + 20log (f) + 20log(d)
Received Signal Strength Indicator (RSSI)
RSSI is a metric that is specified by measuring the amount of energy associated with the bits received via wireless NIC.
Noise Floor
Noise floor is the ambient or background level of radio energy on the specific channel you are analyzing. For wireless NIC to report noise,it has to receive data bits, without that NIC will report as noise variable of zero.
Signal to Noise Ratio (SNR)
SNR can be presented as a dB value or as the difference between the RSSI(signal) and the noise floor(noise). Better the SNR is better the performance. Receive Sensitivity
Receive Sensitivity refers to the power level of an RF signal required to be successfully received by the receiver radio.
Wired & Wireless NIC
Wireless NIC must use its antenna and encoding filter to keep out all unwanted RF signals and thus unwanted bits as well. Also wireless NIC will use some of the specific information gleaned from the RF to bit transition process to actually add information to the wireless frame.
This additional information is added at the receiving station and is in addition to the bits send from the source. This added information called Radiotap Header. Below shows a Radiotap header information of a received beacon frame by a wifi sniffer NIC. All these information is reference to Rx station & not reference to Tx STA.
 RF signal can represent in either time domain or frequency domain. Once you do Fast Fourier Transformation (FFT) for a time domain signal you can get the Frequency domain signal. In RF, mostly Frequency Domain representation is more useful. Hear are some different views available in a spectrum analyzer.
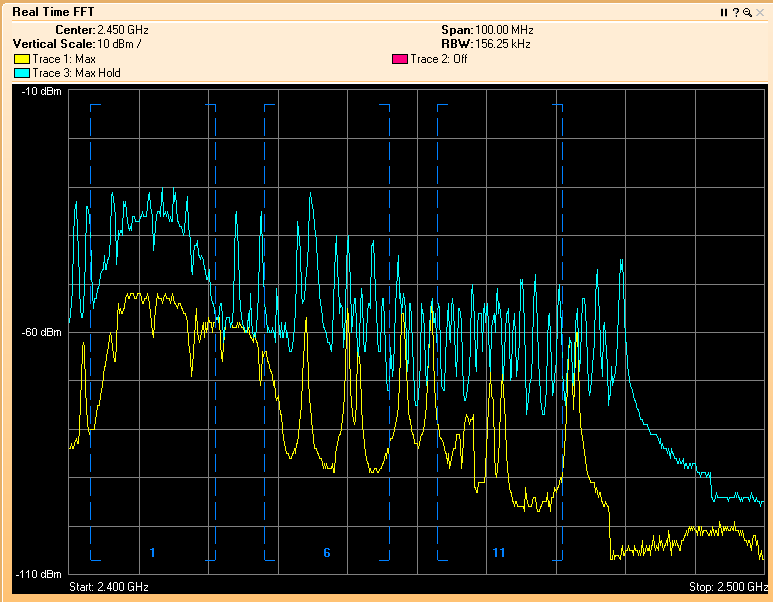
Real Time FFT
Frequency represent in horizontal axis and the energy in dBm defined in vertical axis
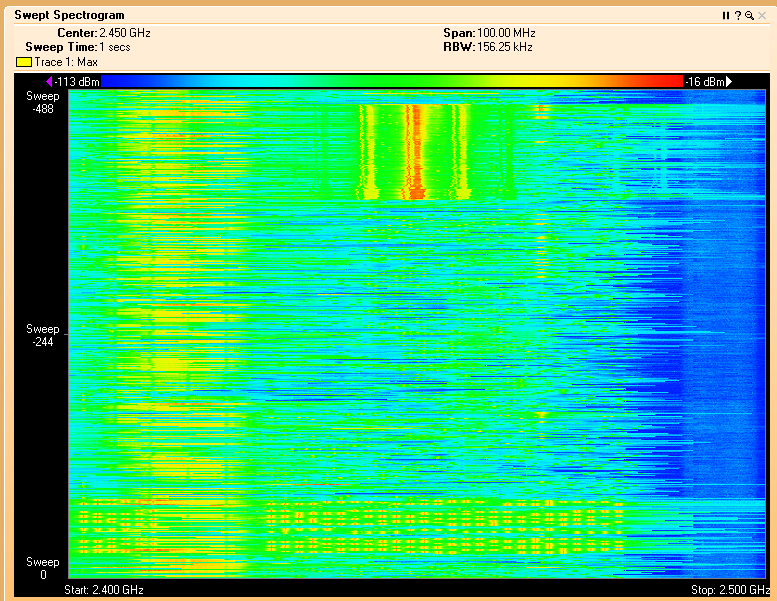
 Spectrogram Graph (Waterfall plot)
This use the same data from Real Time FFT, but with the addition of time dimension. In this view vertical axis shows the historical data. In this case energy in dB values represent in colors (Blue to RED to represent weaker to stronger energy).
 Spectrum Density
Horizontal axis represent frequency & vertical axis represent energy in dBm with brightness of color being determined by how many times that specific bit of information has been captured.
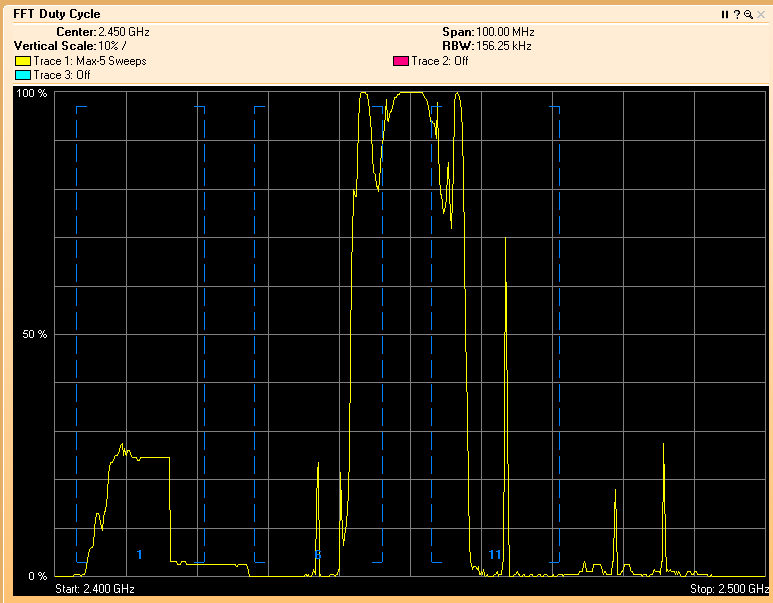
 Duty Cycle
This view displays the percentage of time the ambient RF signal is higher than the noise floor or other predefined signal threshold. In this veiw you can see whether a device is constantly using a frequency (100% duty cycle on a particular channel mean it is not usable & caused by sort of jammers)
 WiFi integration
When spectrum analyzer has WiFi integration capability, it can combined those views. WiFi NIC can scan other channels & report that information to give a overall view on a particular band.
 Here are some RF signatures of particular devices. (Note that all images taken from the CWAP official study guide & George’s my80211.com)
1. Frequency Hopping Portable 2.4GHz telephone
Here is a Real Time FFT view  Here is a same with all different views (FFT, Duty Cycle, Spetrogram)
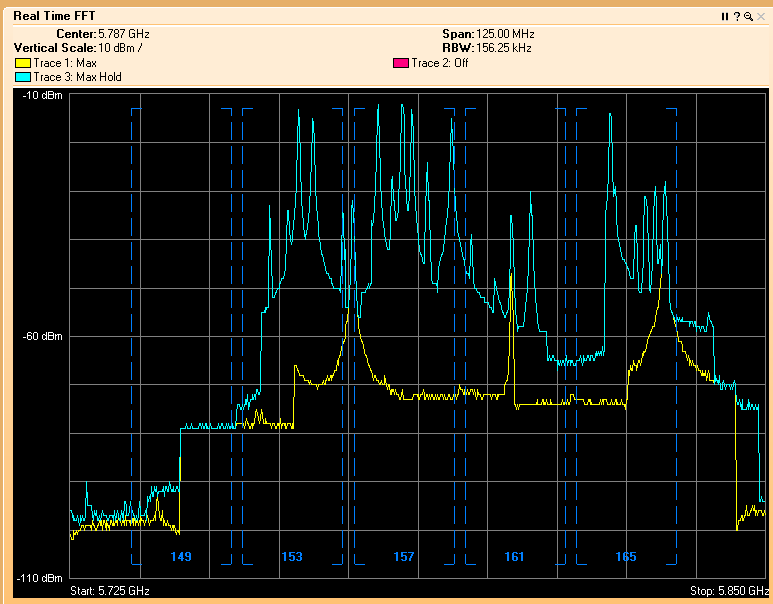
 2. Frequency Hopping Portable 5GHz telephone
 3. Bluetooth Discovery
In discovery mode bluetooth device use pseduorandom frequency selection resulting frequency hopping on the entire 2.4GHz band. Due to fixed pseudorandom sequence all those energy peaks occur at regular interval leaving dots are line up in spectrogram view.

 4. Bluetooth device in operating mode.
In this mode fully random distribution of hotspots (as no fixed psedurandom) in spectrogram view.
5. Real-time FFT of Logitec Analog mouse
It has a narrow signal that drop off quickly.
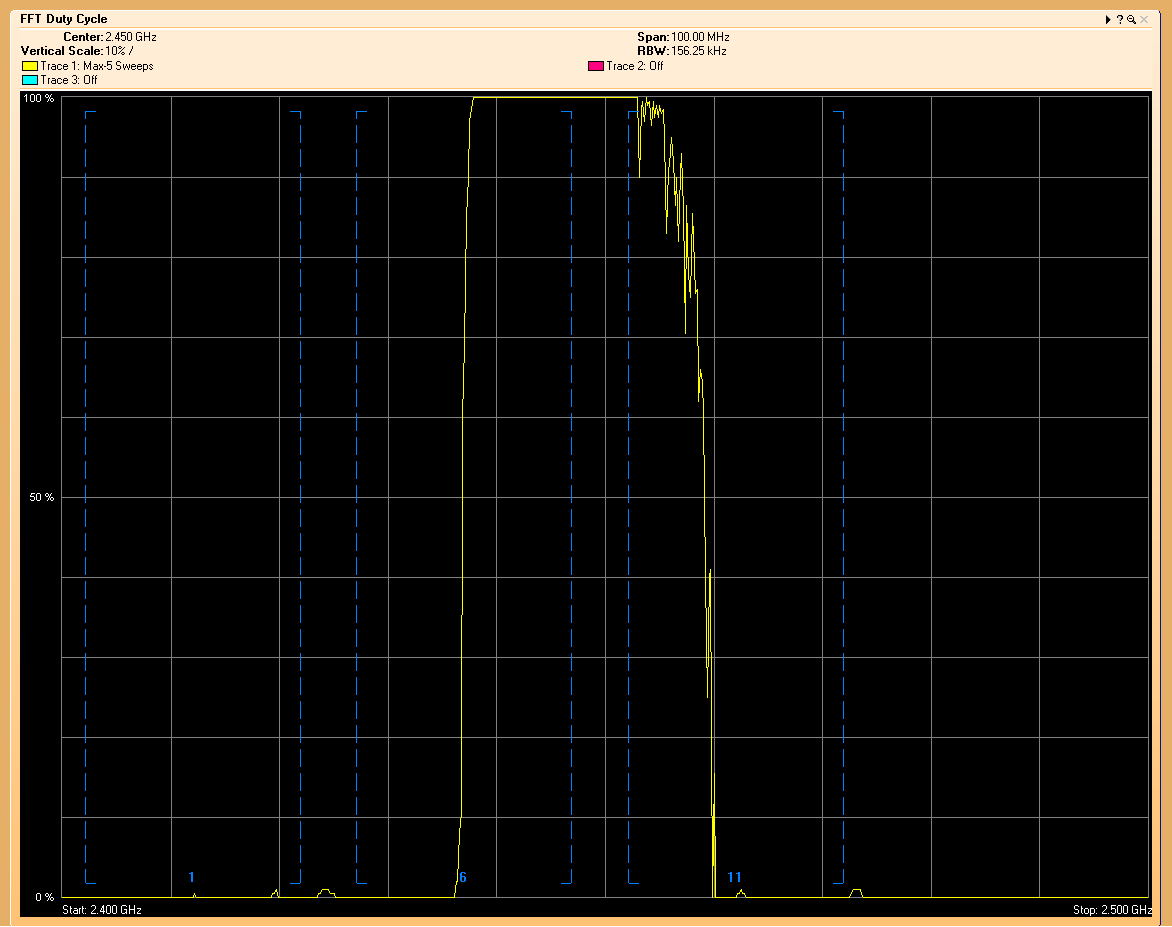
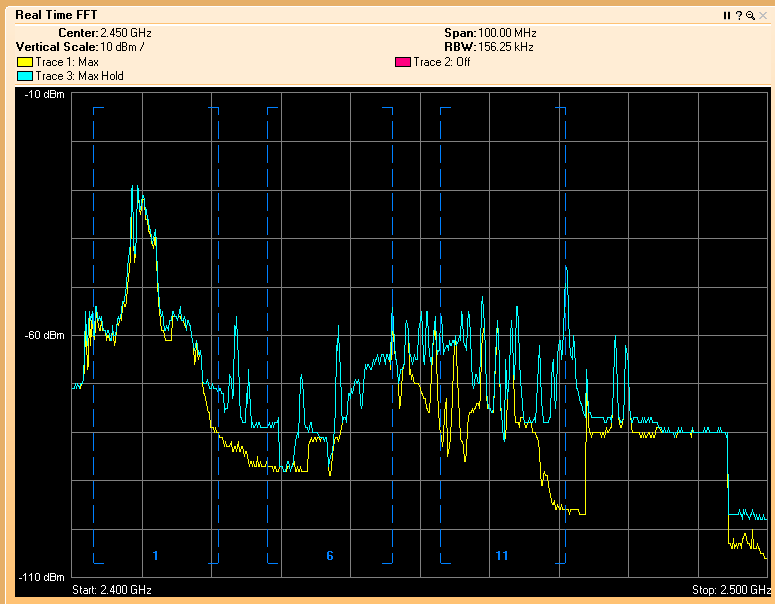
6. Real-time FFT of narrow-band jammer
 Duty Cycle of narrow-band jammer
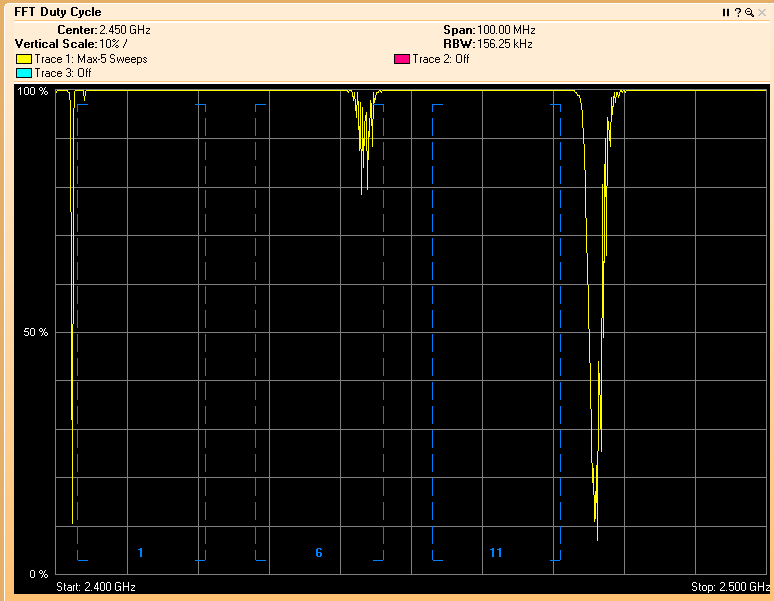
 7. Real-time FFT of 2.4GHz wide band jammer

 8. Real-time FFT of Analog Video Camera
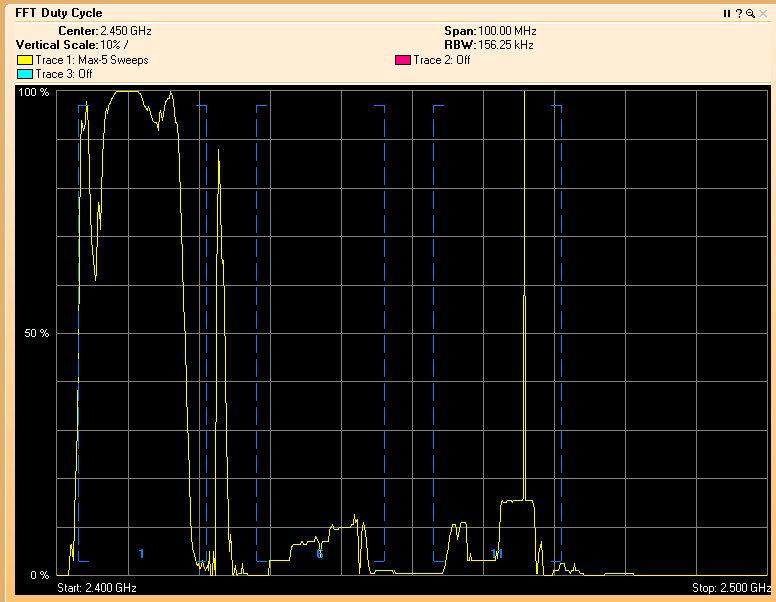 9. Microwave Oven

References
1. CWAP Official Study Guide – Chapter 11

Hi. Great stuff. thanks.
I have 80 APs but there are 2 telecommunication tower around me jamming my signal. I can see channel 6 to 9 is 100% jammed and 5 to 14 20% . however on WLC only one AP reports this jamming problem! if I shutdown that AP then the other one start to report but always one AP reports it. is this normal? are the Aps talk to each other and share responsibilites?! (they are 3500 and 3700 series)
I have 100% jammed on the channel 6 but still the WLC RRM pick the channel 6! many time even pick channel 6 by 2 or 3 AP beside each other. I start to set everything manual and try to assign channel my self (basically keeping APs with the same channel as far as possible from each other).
Beside why WLC is taking stupid decision over channel 6 , if the channel is having 100 % duty cycle why still is it operational? I have clients (a whole class) connected to it. (having problems like speed and drop out but still operational)
your r rock man, thanks for the great stuff you post in here. at some stage you have to archive every thing, make a book and sell it to Cisco 🙂
Your specific RF issue would be a good case study to someone to learn how this RRM stuff working in that unique situation.
Yes, I will see archive my blog & give it to everyone as a pdf book for 0$ including Cisco.
Rasika
God bless you. I am preparing for CWAP and yours blog is going to help me a lot
Thanks Subham
Hi , Do you know any commercially available device which can produce narrow band and Wide band RF interference ? We need to simulated one of our product (WiFi) behavior when such type of interference is present near-by