Tags
If you haven’t used Cisco tools for your WiFi work, then you are missing a great deal of help coming from these tools. All available Cisco wireless troubleshooting tools are listed on the below page. https://developer.cisco.com/docs/wireless-troubleshooting-tools
A brief summary of those tools is given below
- WCAE – Wireless Config Analyzer Express ( AireOS & IOS-XE WLC config analysis)
- WLCCA –Wireless Config Analyzer (AireOS WLC config analysis tool)
- WLC Config Converter (Config conversion between AireOS/IOS-XE)
- Wireless Debug Analyzer (Parses client debug / traces)
- WLAN Poller (Bulk data collection from APs)
- WiFi Hawk (Analyze OTA captures)
- 9800 Guest Shell Scripts (Automate complex data collection)
- 9800 Telemetry Pipeline – Github (Real-time telemetry visualization from 9800)
- 9800 Traces to ELK – Github (Automate trace collection from 9800)
We will look at some of those tools in separate individual posts. In this post let’s look at WiFi Hawk, a tool to analyze your WiFi PCAPs. (No support for Ethernet or any other L2 technologies). You can download a copy of the application from this page.

Here are the key features listed on that page
- Expert system for wireless capture analysis
- Identify hard-to-see issues found in huge files
- Low-level protocol analysis
- Interoperability problems
- Event Flow: Generate a summary of events per client and AP WLANs
- Create Expert reports
- Speed up event identification in a wireless capture
- Automated detection of 18 AP side problems and 16 client issues
- Highlight EAP authentication problems, EAP types
- 802.11 reason codes and status codes explained, including CCX and newer cisco extensions
Application runs on Windows & Mac OS & the following PCAP types are supported. You can read details about them on this page.
- Native dot11 (Mac OS, etc)
- Radiotap (Linux, others)
- Peekremote (AP sniffer mode)
- Omnipeek .pkt (LiveAction)
I have taken a PCAP using sniffer mode AP (refer to this post for how you do it) on CH6 & CH100 which is the channel in my home AP (Cisco 3702 as OEAP). PCAP is 18MB with 66K frames captured. If you are familiar with WiFi frame analysis, you can look at Wireshark & do the analysis. Using WiFi Halk, you can easily visualize what you can see in your environment.
First, you have to run “wifi-hawk.exe” as administrator mode (I am using windows 11). That will give you a GUI wrapper to upload your PCAP. You just need to hit the “Process File” button once the file is uploaded.
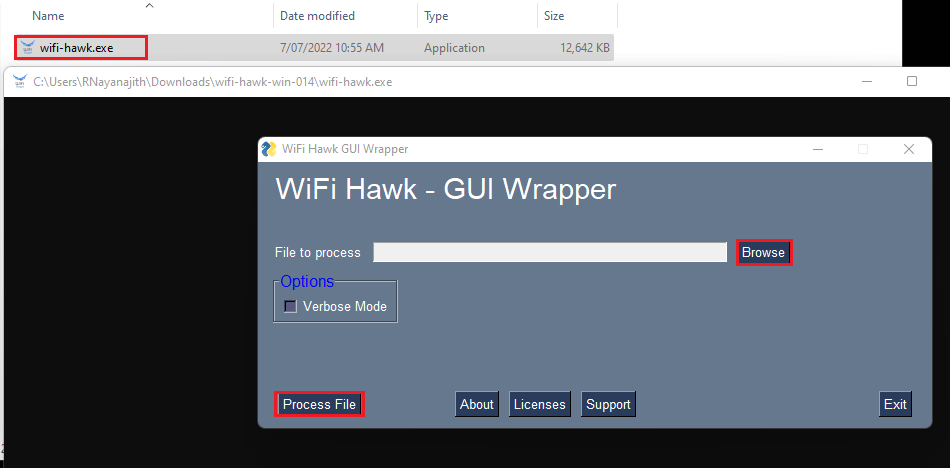
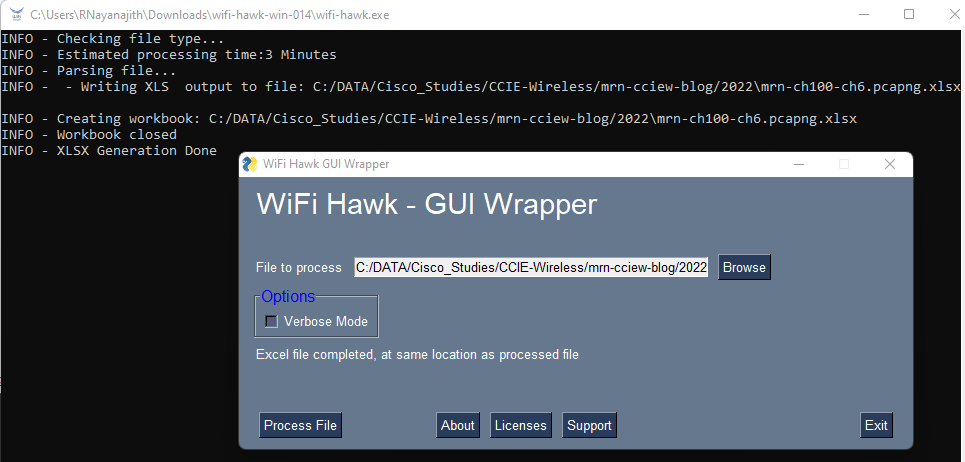
It will show the progress & your .xlsx (Microsoft Excel) report should be in the same folder within a couple of minutes.
Here is the report for you to go through your own to understand what analysis it provides. Here are some highlights of the report. First, you have the “Content” page that gives you a summary of your frame capture & breaks into AP BSSIDs & Clients seen in the capture. You can see it includes 5 BSSIDs on 2.4GHz (CH6) and 2 BSSIDs on 5GHz (CH100). By clicking an individual MAC address (for a client or BSSID) you can get a detailed view of that MAC address.
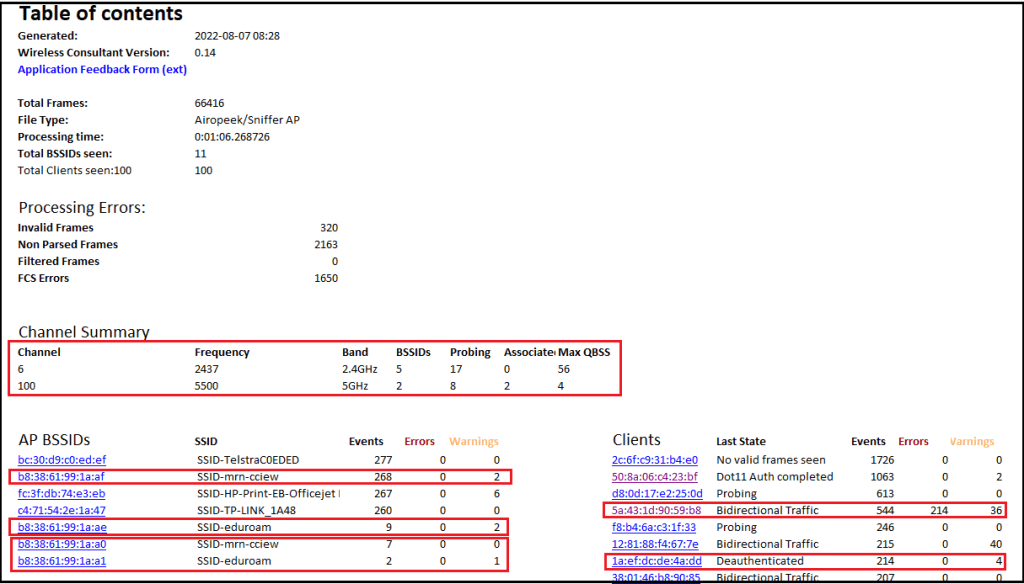
“eduroam” & “mrn-cciew” are the two SSIDs advertised by my AP. The below table shows those BSSID values.
| SSID Name | 5GHz BSSID | 2.4GHz BSSID |
| [PSK] mrn-cciew | b8:38:61:99:1a:a0 | b8:38:61:99:1a:af |
| [802.1X] eduroam | b8:38:61:99:1a:ae | b8:38:61:99:1a:a1 |
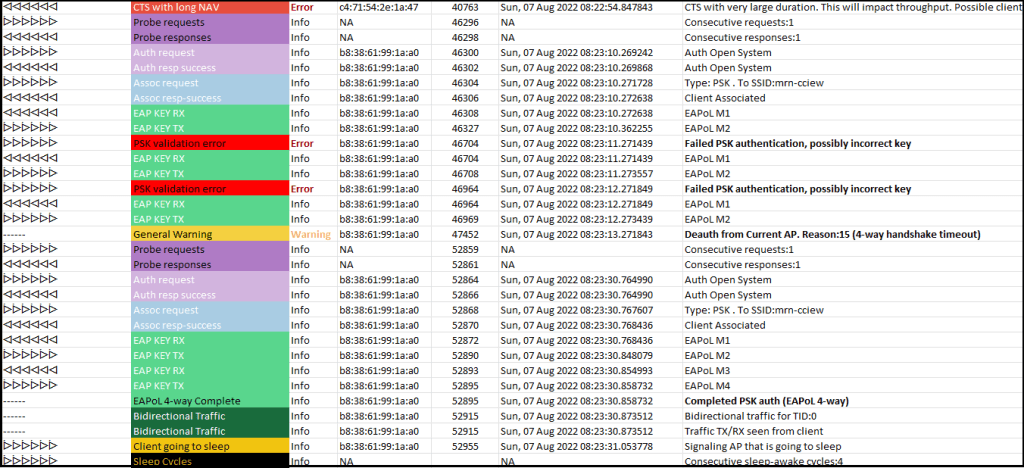
Here are my pix3 phone-specific connection details when it tries to “mrn-cciew” SSID. I have purposely used the wrong password and you can see appear as “Error” & indicating a possible incorrect key entry (indeed it is 🙂 ). By looking at the flow of events (focusing on Error/Warning severity) you can easily identify issues. You can easily identify a client’s sleeping pattern, probing behavior and many other client capabilities can be easily identified.
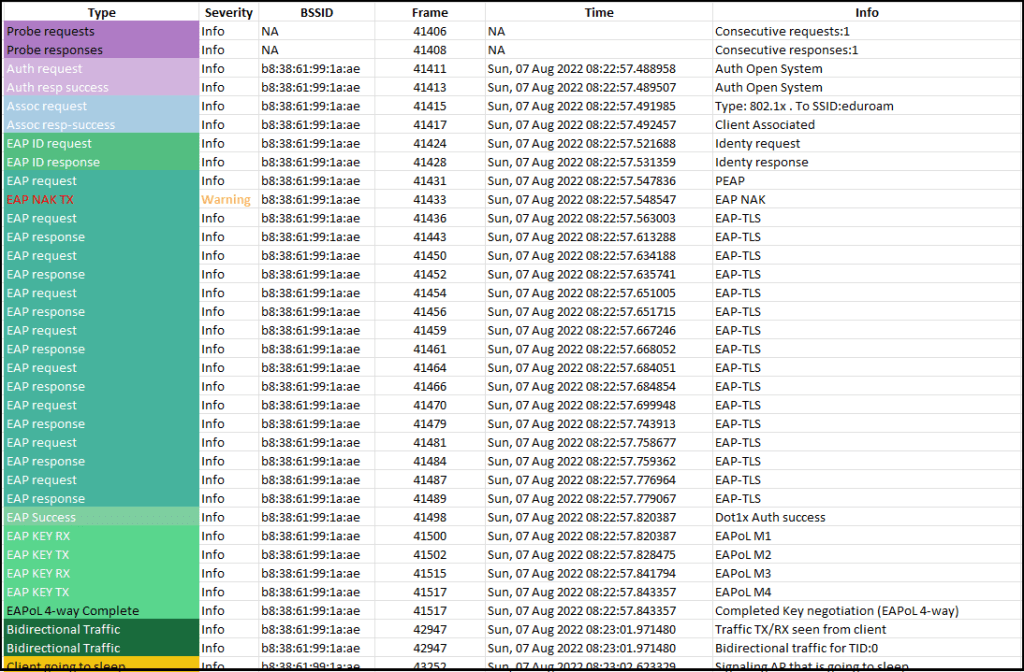
Here is the flow of events when my phone is connecting to “eduroam” using EAP-TLS. Note that the phone use “random mac address” & it is highlighted as well.
This tool gives multiple graphical representations, eg Client Histogram, AP Histogram, RSSI vs SNR, TID, etc. You can learn all those from the below link https://developer.cisco.com/docs/wireless-troubleshooting-tools/#!features/wifi-hawk-features
I did another PCAP (267k frames & ~175MB) while doing a speedtest from my phone. It took 4min to process & gave no error. When I had a different file ( 567k frames 332MB), the application gave me an error during the half way through processing.
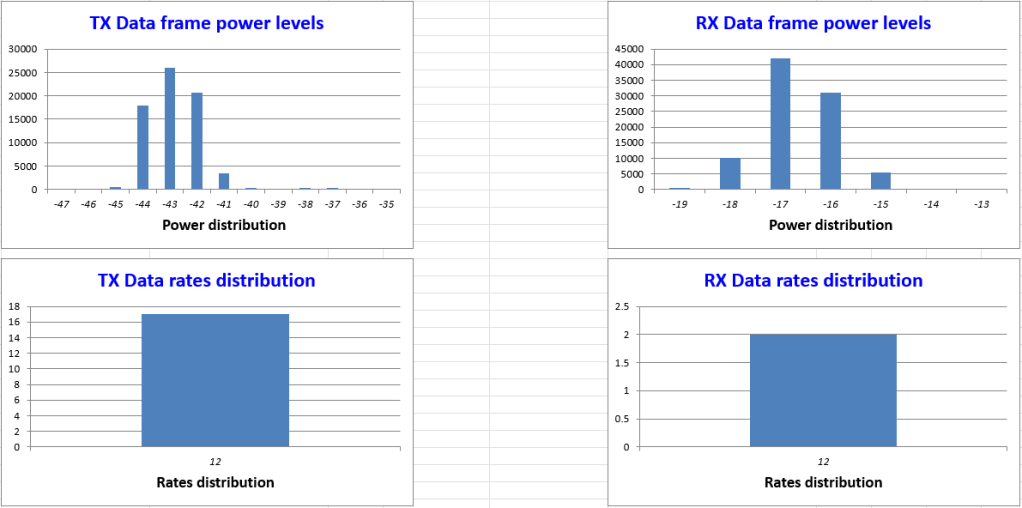
Here is some of the visualization. RSSI vs SNR graph looks only plotting only legacy rates used by control & management frames (seems like not getting MCS rates for data frames). Documentations state MCS rates should be supported from v0.12 onward (tested this on v0.14). Cisco has listed “wifi-hawk@cisco.com” as support contact & for us to provide feedback on feature requests. You should reach out to them if you have experienced any issues or if you have a feature request to make.

Below shows Tx/Rx data frames power distribution and data rates distributions (as highlighted earlier, only shows 12Mbps which is not right. Most of my data frames used MCS rates.
As you can see, WiFi Hawk is a very convenient “free” tool to get your PCAP to analyze & understand issues in your WiFi environment. Start using the tools whenever you doing an analysis with PCAP.
Note: Need to say a word about Cisco support. I sent an email to the WiFi Hawk support email listed on that page about the issue I saw above. Within a few hrs both Surendra BG & Javier Contreras reached out to me on that query (you know you are with the best support when these people are looking at your query)
Update: Received an updated email response from Javier on those 2 issues, Thought it may be useful to you.
Issue#1 (Did not able to parse the file-332MB) – There is no limit on PCAP size.
“I got it fixed, fix will be on next version (trying to wrap it for this week, or beginning next) Issue was a client event due to be on sleeping mode when the capture ended“
Issue#2 MCS rates seem not shown on those histograms
“This would be a bit more complicated. Basically, the header has MCS rate index, and a flag on width (20) and streams (2), I need to write a function to map this to mbps, to have proper correlation to legacy rates
Right now, the header I am using does not support the flags needed, so this will take some little more effort to get it done“
